Copilot in Power BI: Building Reports with Natural Language
You can use Copilot to generate reports and DAX measures.
Why this lesson matters
Microsoft has put AI straight into Power BI. Copilot promises that you can build reports, generate DAX formulas and pull insights out of data in plain language, without dragging and clicking by hand.
Sounds like magic. The reality has more nuance. Copilot only works under specific conditions, has its limits, and only pays off once you know how to steer it. In this lesson you'll learn what Copilot in Power BI can actually do, what you need to use it, and where you shouldn't trust it blindly.
What is Copilot in Power BI?
Copilot is an AI assistant built directly into Power BI Desktop and the Power BI service. It runs on a language model via Azure OpenAI and can:
- Generate reports based on your data model
- Write DAX measures from a description in plain language
- Create summaries of your visual report pages
- Answer questions about your dataset
For example, you type: "Create an overview of revenue by region by quarter" and Copilot builds the visuals.
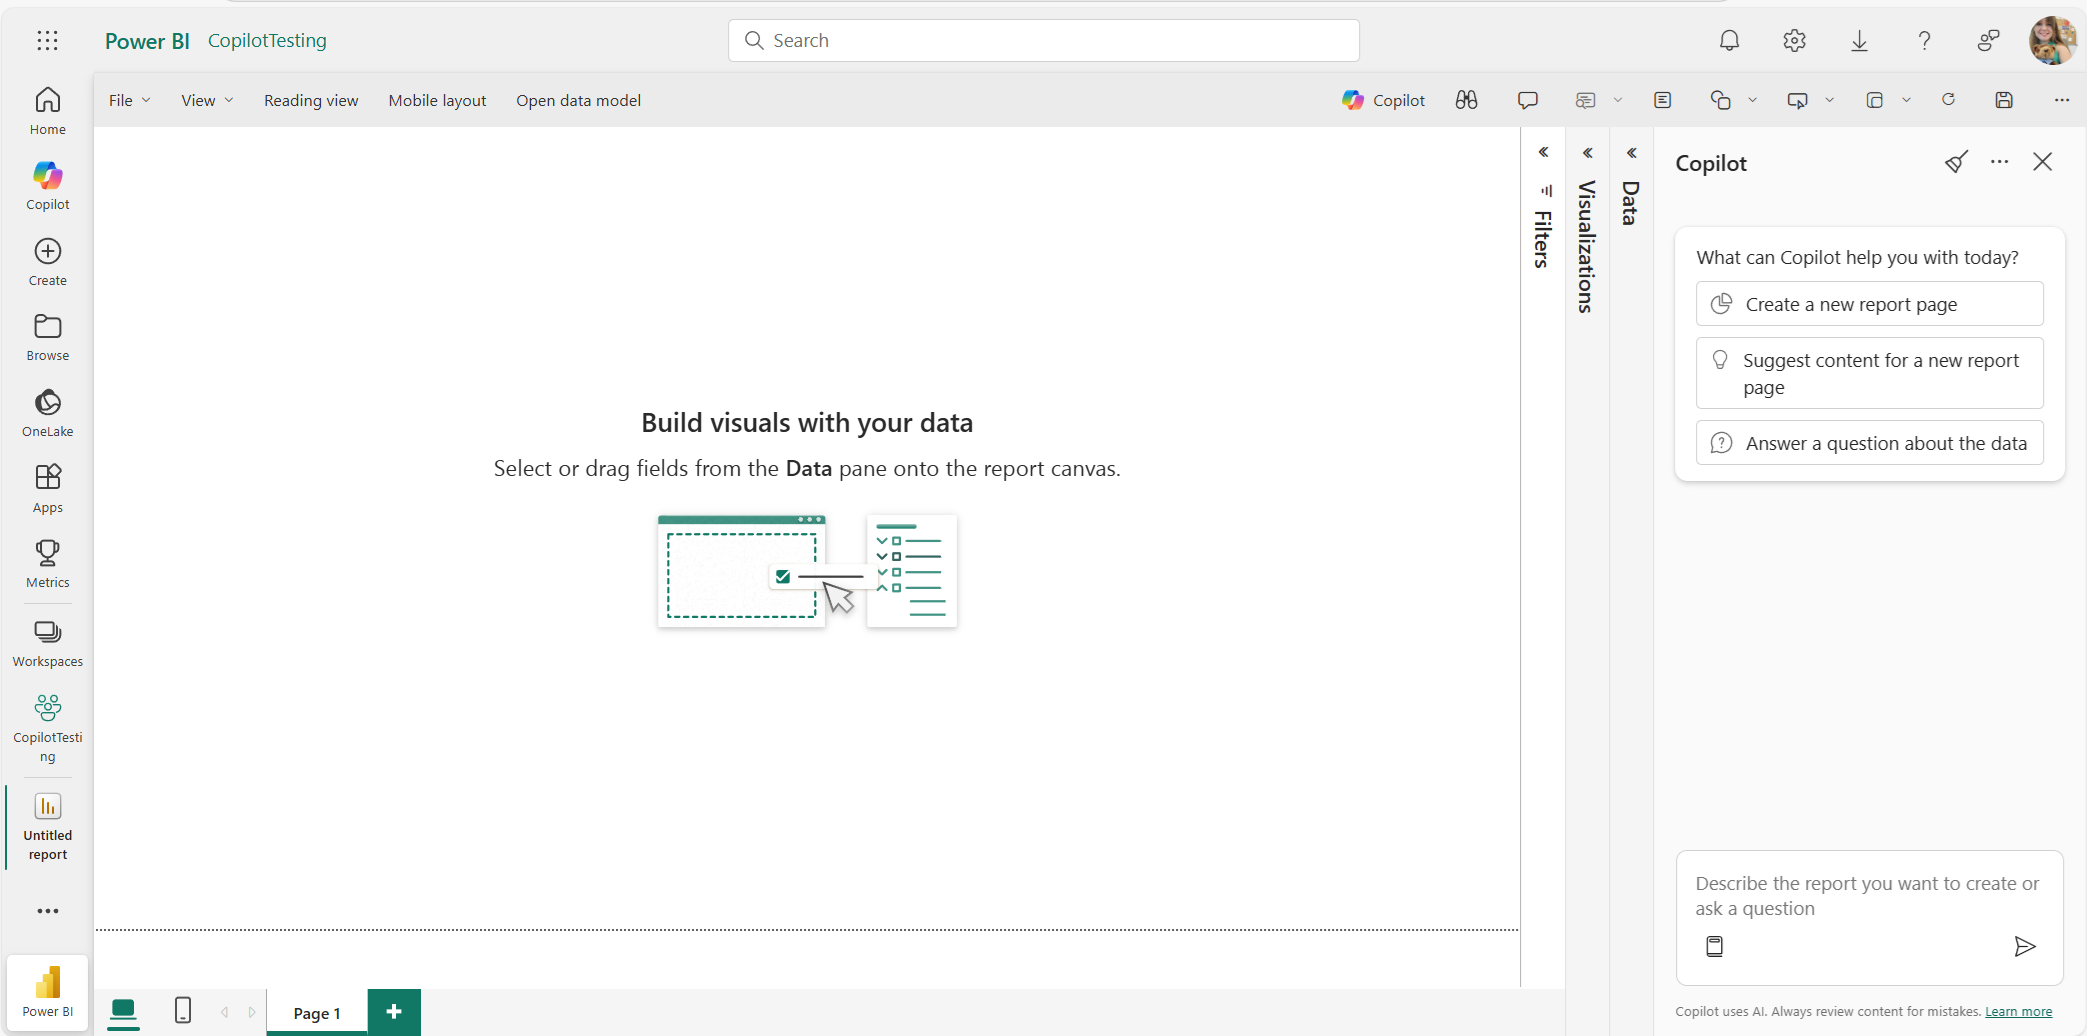
Copilot is part of the Power BI interface itself: it sits in the Copilot pane on the right. You don't have to switch between applications.
Requirements: what do you need?
This is where most organisations stumble. Copilot in Power BI isn't available to everyone.
| Requirement | Details |
|---|---|
| Microsoft Fabric licence | Paid capacity from F2 up, or Power BI Premium P1 and higher. A trial capacity doesn't count |
| Tenant setting | An admin has to enable Copilot in the Fabric admin portal |
| Data location | Your data has to be in a supported region (EU, US, UK, AU) |
| Semantic model | Copilot only works on import or Direct Lake models; DirectQuery isn't supported |
| Language setting | Copilot works best in English, but also supports Dutch |
No Fabric licence? Then you simply won't see the Copilot icon. This is the most common reason teams think it "doesn't work". Check your licence first before you start troubleshooting.
Generating reports with Copilot
Keep reading
Leave your name and email address and you can read the rest
You get the whole lesson right away, and every other lesson stays open after that. No password, no confirmation email.
The most visible use: you open a new report, click the Copilot icon, and describe what you want to see.
Step by step
- 1Open Power BI Desktop or the service
- 2Connect to a dataset (import or Direct Lake)
- 3Click the Copilot icon in the ribbon
- 4Describe your report in the text box
- 5Copilot generates a page with visuals
- 6Adjust where needed
Example prompt
Create a report page with:
- Total revenue as a KPI card at the top
- Revenue by product category as a bar chart
- Revenue trend by month as a line chart
- Table with the top 10 customers by revenueThe more specific your prompt, the better the result. Name column names from your model, the visual types you want, and layout preferences. Copilot is an AI assistant. It can't read your mind.
Generating DAX measures
For many Power BI users, DAX is the biggest hurdle. Copilot can write DAX formulas based on a description.
Example:
You type:
Create a measure that calculates revenue growth compared to the same month last year, as a percentage.Copilot generates:
Omzetgroei YoY % =
VAR HuidigeMaand = [Totale Omzet]
VAR VorigJaar = CALCULATE([Totale Omzet], SAMEPERIODLASTYEAR('Datum'[Datum]))
RETURN
IF(NOT ISBLANK(VorigJaar), DIVIDE(HuidigeMaand - VorigJaar, VorigJaar))Always check the generated DAX. Copilot knows your data model, but sometimes makes assumptions about column names or relationships that are wrong. Validate the result against known data before you put it into production.
Limitations you need to know
Copilot works well, but it isn't almighty. Be aware of these limitations:
- No complex data modelling - Copilot doesn't create relationships and doesn't change your model
- DirectQuery not supported - Import and Direct Lake models only
- Hallucinations - Copilot can suggest measures that are syntactically correct but logically wrong
- No RLS awareness - Copilot ignores Row-Level Security in its suggestions
- Language barrier - Dutch prompts sometimes give less accurate results than English ones
- No undo for generated pages - What Copilot builds, you clean up by hand
Practical tip: the best workflow
Use Copilot as a starting point:
- 1Let Copilot generate a first version of your report
- 2Check which visuals and measures are correct
- 3Adjust layout, colours and filters by hand
- 4Validate DAX measures against known outcomes
- 5Add context Copilot can't come up with (titles, explanations, formatting)
Think of Copilot as a junior colleague who quickly puts together a first draft. You're the senior who finishes it.
What is the minimum licence you need to use Copilot in Power BI?
Why do you always have to check DAX generated by Copilot?
Want to keep your progress, get the practice files and sign up for the free evening? Create a free account. All you do is click a link in your email.
Create a free account