Q&A Visual: Asking Questions to Your Data
You configure Q&A so end users can ask questions in natural language.
Why this lesson matters
You've built a beautiful Power BI report. Nice visuals, clever measures, everything adds up. But your end users? They open the report, stare at the charts, and ask: "But how much revenue did we have in March in region North?"
The Q&A visual solves this problem. End users can ask questions of the data in plain language, without having to understand filters or click through slicers. But it only works well if you configure it well.
What is the Q&A visual?
The Q&A visual is a built-in part of Power BI that lets users type questions in natural language. Power BI interprets the question and automatically generates a visual as the answer.
Examples of questions users can ask:
Total revenue by region
How many orders in Q3 2024?
Average order value by product category as a bar chart
Top 5 customers by revenue last year
The Q&A engine uses the data model, column names and synonyms to translate the question into a DAX query.
The Q&A visual is available in every Power BI licence, including Pro. You don't need Fabric or Premium. That makes it a low-threshold AI feature you can use right away.
Adding and configuring the Q&A visual
Adding it to your report
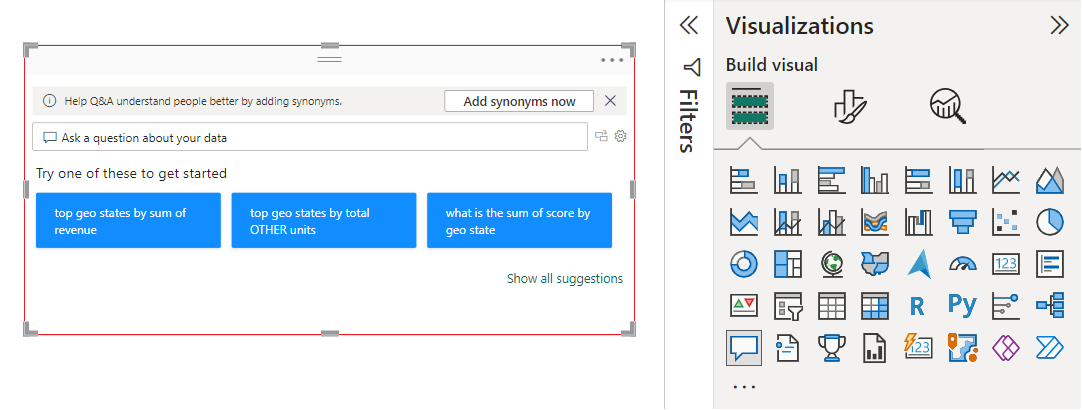
- 1Go to your report page in Power BI Desktop
- 2In the Visualizations pane, click the Q&A icon (question mark)
- 3Drag the visual to the position you want on your canvas
- 4The visual immediately shows a text box where users can type
Preparing the model
Keep reading
Leave your name and email address and you can read the rest
You get the whole lesson right away, and every other lesson stays open after that. No password, no confirmation email.
The quality of Q&A stands or falls with your data model. Power BI uses column names and table names to interpret questions.
| Problem | Solution |
|---|---|
Column is called fct_rev_amt | Rename it to Omzet or set up a synonym |
Table is called dim_cust_v2 | Rename it to Klanten |
Date column is called dt_key | Rename it to Datum or Orderdatum |
Several tables with Naam | Use distinguishing names: Klantnaam, Productnaam |
If your column names are cryptic (as they often are in data warehouses), Q&A will misinterpret your users' questions. Invest 30 minutes in renaming columns. It saves you hours of support.
Setting up synonyms
Synonyms are the secret power of Q&A. They teach Power BI that "omzet", "revenue", "verkoop" and "sales" all point to the same column.
Managing synonyms
- 1Go to Modeling > Manage synonyms (or via Q&A setup)
- 2Select a table and column
- 3Add synonyms, separated by commas
- 4Test the synonyms in the Q&A window
Example synonym setup
Column: Totale Omzet
Synonyms: omzet, revenue, verkoop, sales, opbrengst

Column: Klantnaam
Synonyms: klant, afnemer, account, customer

Column: Orderdatum
Synonyms: datum, bestelmoment, wanneer besteld, order dateThink from your end user's point of view. What do they call the data in everyday language? Sales calls them "customers", finance calls them "debtors", and operations says "accounts". Add them all.
Training Q&A with suggested questions
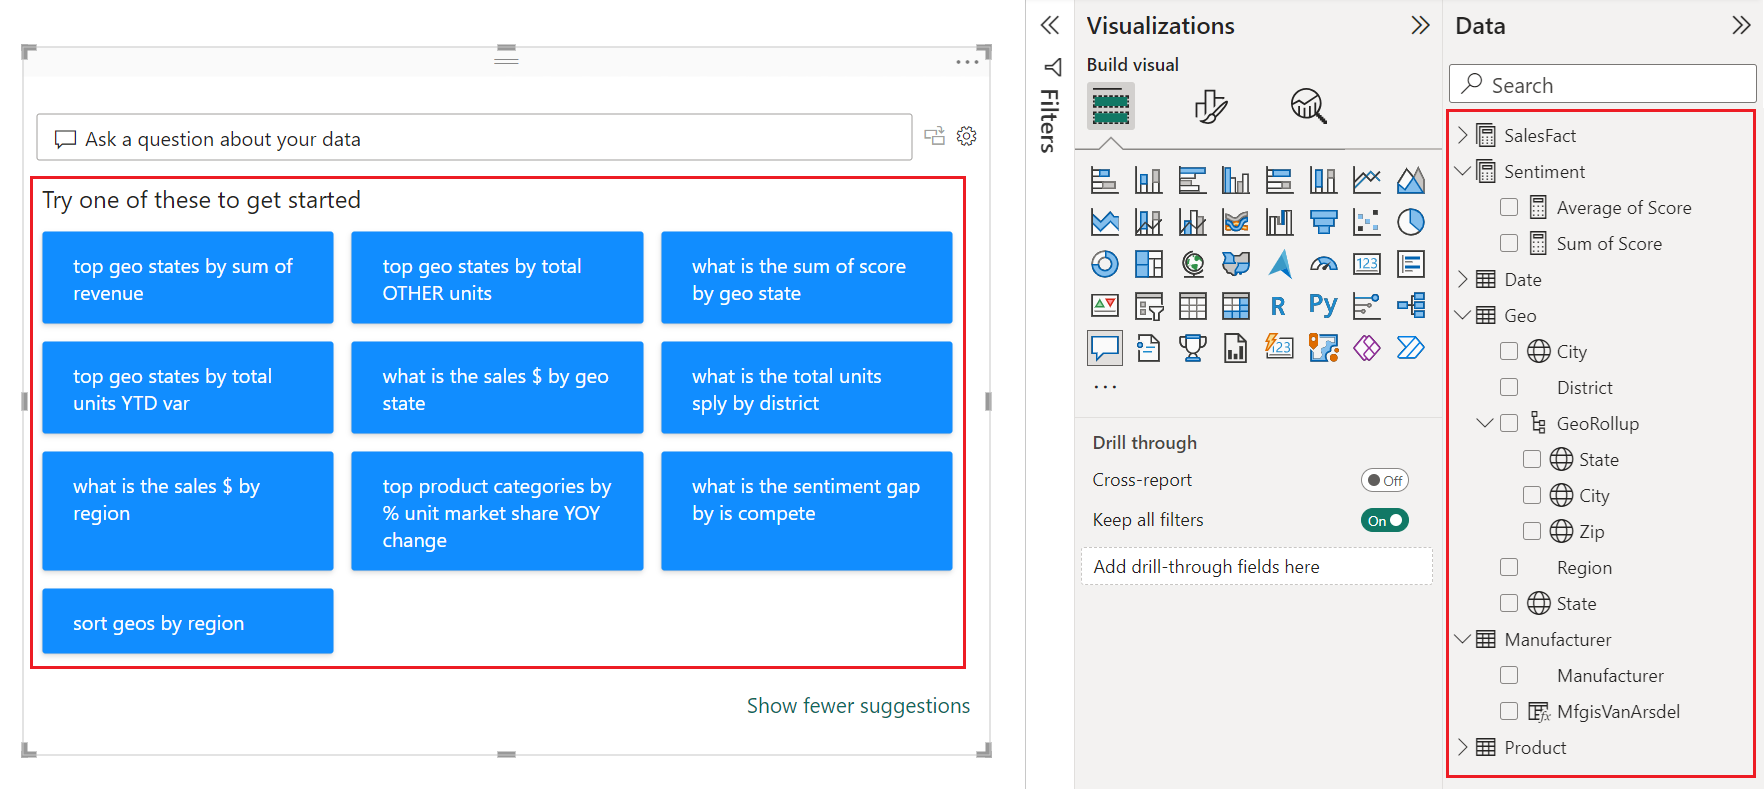
You can set up suggested questions that users see when they open the Q&A visual. This gives them a starting point and teaches them the kind of questions that work.
Adding suggested questions
- 1Select the Q&A visual
- 2Click the gear icon (Q&A setup)
- 3Go to Suggest questions
- 4Add 3-5 frequently asked questions
Good suggested questions:
Total revenue this quarter
Top 10 products by margin
Revenue by region as a map
Number of orders per month as a line chartTraining end users
Configuring the technology is half the job. The other half: teaching your users how to ask questions.
What users need to know
- 1Use column names - "revenue by region" works better than "how much money per area"
- 2Be specific - "revenue in 2024" is better than "recent revenue"
- 3Name the visual type - Add "as a table" or "as a bar chart"
- 4Filters in the question - "revenue in region North in Q3" works as a filter
Communication approach
Record a short video or Loom of 2 minutes instead of writing a 10-page manual:
- Show where the text box is
- Ask 3 example questions
- Show how the answer changes when you get more specific
What is the most important thing to do before Q&A works well?
Why are synonyms important for the Q&A visual?
Want to keep your progress, get the practice files and sign up for the free evening? Create a free account. All you do is click a link in your email.
Create a free account