Building Your Data Model: Star vs Snowflake
You understand the difference between star and snowflake schemas and can set up a reliable data model.
You can connect tables with the right relationships and set up a STAR schema.
You've fetched and cleaned your data neatly in Power Query. Everything looks ready for building visuals. But as soon as you use filters or combine several tables, the numbers suddenly stop adding up. Sound familiar?
That's almost always down to a mistake in the data model. And that's what we're going to talk about now.
Power BI works differently from Excel. In Excel you can cram everything into one big table. In Power BI you build a model with facts and dimensions, which you connect through relationships. If you get those relationships wrong, your analysis falls apart, even though the dashboard looks fine.
"Power BI lets you do it… until you publish and someone filters on year. Then you suddenly see double revenue."
Fact tables and dimension tables
First the difference:
- Fact table = transactions, events, measurable things. For example: sales lines, invoices, journal lines.
- Dimension table = descriptive information. For example: customers, products, calendar, employees.
Can you count it, sum it or calculate with it? Fact. Does it describe what, who, where or when? Dimension. Not sure? Then it's usually a dimension, facts are almost always transactional.
A star schema is a simple data model structure in which one central fact table is surrounded by several dimension tables. The fact table holds quantitative data (such as sales, costs or quantities), while the dimension tables provide context for that data (such as time, product or customer).
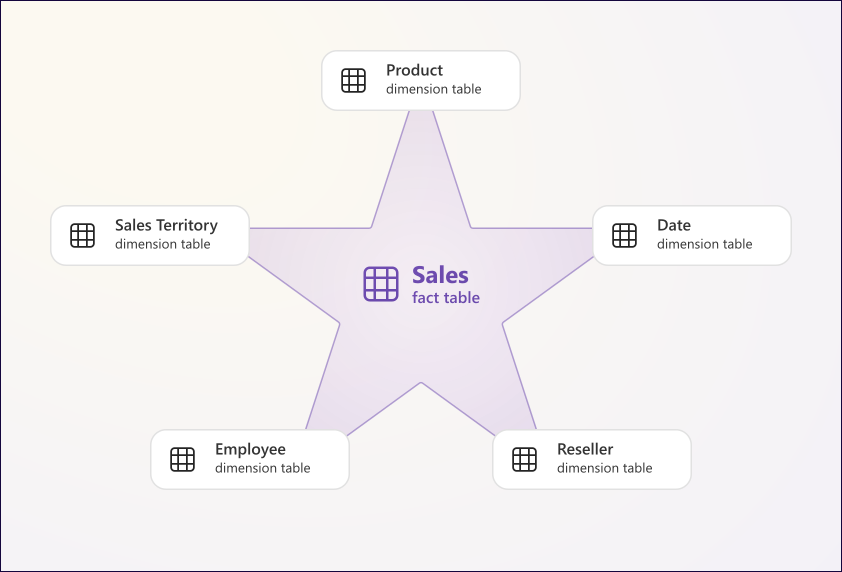
Characteristics of the star schema
- Simple structure: easy to understand and to implement.
- Direct relationships: the fact table has a direct relationship with every dimension table, which leads to faster query performance.
- Best performance: because the model is so simple, fewer relationships are needed while running queries.
Example of a star schema
You're working with sales data. You have a fact table called Verkoop that holds information such as Verkoopbedrag, Aantal and KlantID. You also have dimension tables such as Klanten, Producten and Tijd. Each dimension table gives extra context to the sales data.
Your model always starts at the fact table. You connect it to the dimensions through unique keys. That gives you a Star Schema: one central table, with rays out to the edge. Star Schema = stable, fast and reliable.
Normalisation and denormalisation, what it is and why you need to understand it
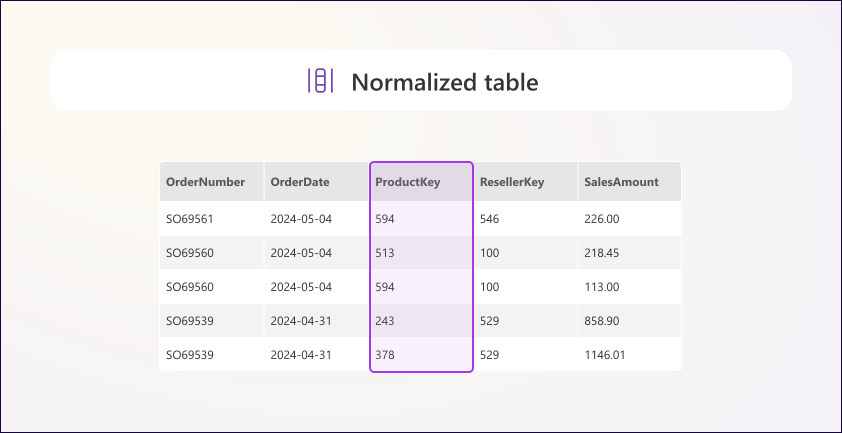
Normalisation means splitting your data into logical tables. Each table has one subject and as little repetition as possible.
- Customers in a customer table
- Products in a product table
- Transactions in a fact table with keys
You see this in almost every source system. Because it:
- Produces fewer errors
- Is easy to maintain
- Works efficiently for databases
Keep reading
Leave your name and email address and you can read the rest
You get the whole lesson right away, and every other lesson stays open after that. No password, no confirmation email.
Denormalisation is the opposite. You glue information together so everything sits in one table.
- The customer name is on every order line
- The product category is repeated every time
- The region sits in the same row as the amount
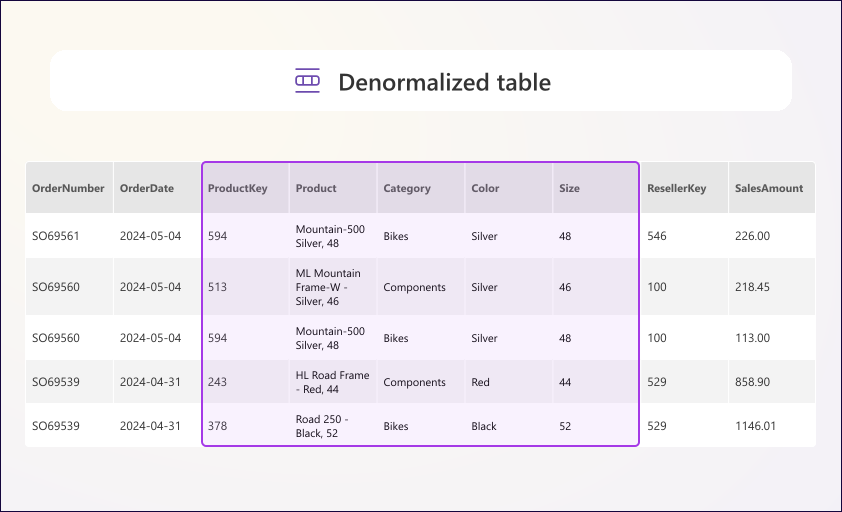
That reads nicely in Excel and feels clear. Until you start analysing.
And that's where Power BI comes in. Power BI is a calculation engine based on filter context. It works best when:
- Amounts sit in one place
- Context (who, what, when) is kept separate
- Filters flow in a controlled way from dimension to fact
If you denormalise everything:
- You get duplicate information
- DAX formulas become more complicated than they need to be
- You can get wrong totals without noticing
- You'll see performance problems with larger datasets
So the practical rule in Power BI is:
- Source data may be normalised
- Report data you model as a star schema
- Denormalise only deliberately and sparingly
Creating relationships
Power BI sometimes creates relationships on its own, but they're far from always right. Always check them in the Model view.
Key points:
- Choose one-to-many (1:*) from the dimension to the fact table. For example: one customer → many sales lines.
- Set the filter direction to "Single".
- No duplicate relationships between the same tables: that confuses Power BI.
Later in this module (lesson 1.7) we'll go deeper into why we aim for one-to-many (1:*) and single relationships.
Check:
- Is the key column unique in the dimension table?
- Are there no nulls or empty values in it?
- Is the data type the same on both sides?
In a star schema you have a fact table "Verkoopregels" and dimension tables "Klanten", "Producten" and "Datum". Which table sits in the middle?
Star vs snowflake, when to use which?
Some people build a snowflake schema: a dimension table with its own sub-tables (for example: products → categories → suppliers). Looks tidy, but makes your model needlessly complex for most Power BI scenarios.
| Aspect | Star Schema | Snowflake Schema |
|---|---|---|
| Structure | Flat: 1 level of dimensions | Nested: dimensions with sub-tables |
| Number of relationships | Minimal | Many |
| Query performance | Fast (fewer joins) | Slower (more joins) |
| DAX complexity | Low | Higher |
| Maintenance | Simple | Harder |
| Best for | Import mode, BI reports | Very large datasets, DirectQuery |
| Microsoft's advice | Recommended default | Only where needed |
Unless you really have large datasets or work with specialist calculations: stick with a Star Schema.
"Sounds theoretical? In practice, this is where it goes wrong."
You have a relationship between Klanten (1) and Verkoopregels (*). In which direction does this relationship filter by default?
A bit deeper: bidirectional relationships
Sometimes Power BI suggests creating a bidirectional relationship. Sounds handy, because then everything filters both ways. But it's dangerous.
Bidirectional relationships:
- Often lead to circles in your model
- Make DAX formulas harder
- Can lead to double counting
Advice: better to avoid this, it keeps complexity down.
Tips and checks from practice
- Start at the fact table and draw your model as a star
- Check that your keys are truly unique in the dimension tables
- Join on IDs, never on names or descriptions
- Preferably set the filter direction to one way (single)
- Never connect columns of different types (text vs number = error)
Practical example
You have three tables:
- Verkoopregels with customer ID and product ID
- Klanten with customer ID, name and region
- Producten with product ID, name and category
At first sight everything is fine. But someone has stored the customer ID as text in Klanten, and as a number in Verkoopregels. Power BI then cannot create a relationship at all.
It looks like your model works, until you filter. Then you get duplicate rows, empty visuals or wrong totals.
How to prevent it:
- Always join on unique, stable IDs
- Check that both columns have exactly the same data type
- Use the Model view to check visually that everything is right
- Test your relationships by building a simple table visual with a filter
- Download
dim_feit.pptxand label each block as a fact or a dimension. - Open the Excel file
Les-1.2-powerbi-oefenbestand.xlsx. - Create relationships between these tables: Verkoopregels → Klanten (via customer ID), Verkoopregels → Producten (via product ID).
- Go to the Model view and check: are all relationships 1:* with the right filter direction? Rename unclear tables or columns. Test with a table visual: show revenue per customer, and filter on year.
- A Star Schema has one fact table in the middle with dimension tables around it, simple, fast and the Microsoft default.
- Facts are measurable; dimensions are descriptive.
- You create relationships 1:* from dimension to fact, with single filter direction.
- Avoid bidirectional relationships and denormalisation unless you have a specific reason for them.
- Always test your relationships with a filter test before you publish a report.
Reflection question
Do you still use Excel tables at work without clear relationships? How sure are you then that your numbers are right when you filter or select?
Want to keep your progress, get the practice files and sign up for the free evening? Create a free account. All you do is click a link in your email.
Create a free account