Time Intelligence, YTD Analysis and Date Tables
You understand time intelligence functions and build a date table.
You can build YTD, MTD and prior-year comparisons with the help of a date table in Power BI.
Say you want to know how your revenue develops over the course of the year. Or how much better you're doing than last year. Sounds simple, but without a proper date table you won't get there. And what you get instead is this:
- Your YTD looks fine… but stops on 30 June
- Your "last year" revenue counts everything from January through December, even when you're filtering on April
- Your month comparison returns zero because the date can't be found
This happens surprisingly often. Time intelligence in Power BI only works when your model meets a few strict requirements.
Why a date table matters
Power BI has time functions like TOTALYTD() and SAMEPERIODLASTYEAR(). But they only work if you:
- Have a separate date table
date table
- Create a relationship between that date table and your fact table (e.g. Verkoopregels[Datum])
- Only use dates from the date table in visuals and slicers
Using the date column from your transaction data? Then those functions won't work properly. And you'll get wrong totals or empty visuals.
won't work properly
Why can't you just use the date column from your fact table for time intelligence?
How to create a date table
The easiest way is with DAX:
Datum = CALENDAR( DATE(2020, 1, 1), DATE(2025, 12, 31) )Or let Power BI work out the range automatically from your data:
Datum = CALENDARAUTO()Then add columns for year, month, quarter and so on:
Jaar = YEAR( Datum[Date] )
Maandnummer = MONTH( Datum[Date] )
Maandnaam = FORMAT( Datum[Date], "MMMM" )
Kwartaal = "Q" & FORMAT( Datum[Date], "Q" )CALENDARAUTO() scans every date column in your model and builds a table from 1 January of the earliest year to 31 December of the latest year. Handy, but always check that the range is right.
Option 1 - Use a standard template and load it into Power BI
Use the template from the attachment to this lesson. That way you always have a complete date table that keeps itself up to date and meets every requirement.
Option 2, Automatically in DAX:
Then add extra columns such as:
- Jaar = YEAR([Datum])
- Maand = FORMAT([Datum], "MMMM")
- JaarMaand = FORMAT([Datum], "YYYY-MM")
- Kwartaal = "Q" & FORMAT([Datum], "Q")
Option 3, By hand in Excel (bad idea):
Some people build their own date file in Excel. Don't. Far too error-prone and it doesn't scale.
Building time intelligence measures
Keep reading
Leave your name and email address and you can read the rest
You get the whole lesson right away, and every other lesson stays open after that. No password, no confirmation email.
For these examples you need a date table called "Kalender" with a column Datum, related to Verkoopregels[Datum].
Year-To-Date (YTD)
OmzetYTD = TOTALYTD( [TotaleOmzet], Kalender[Datum])
Shows revenue from 1 January up to the current filter moment.
Last Year (prior year, same period)
Use this to compare performance across years.
Growth versus last year
- OmzetGroei = [OmzetYTD] - [OmzetVorigJaar]
- OmzetGroeiProcent = DIVIDE([OmzetGroei], [OmzetVorigJaar])
That gives you both absolute and percentage growth.
Month-To-Date / Quarter-To-Date
- OmzetMTD = TOTALMTD([TotaleOmzet], Kalender[Datum])
- OmzetQTD = TOTALQTD([TotaleOmzet], Kalender[Datum])
Use these for monthly or quarterly reporting.
You want to calculate Year-to-Date revenue. Which DAX function do you use?
You have the measure OmzetVorigJaar = CALCULATE( [TotaleOmzet], SAMEPERIODLASTYEAR( Datum[Datum] ) ). In January 2024 you filter on March. Which period does this measure calculate?
DATEADD, the flexible alternative
SAMEPERIODLASTYEAR always shifts exactly one year. But what if you want to compare per quarter or per month? For that you use DATEADD:
OmzetVorigKwartaal =
CALCULATE( [TotaleOmzet], DATEADD( Datum[Datum], -1, QUARTER ) )OmzetVorigeMaand =
CALCULATE( [TotaleOmzet], DATEADD( Datum[Datum], -1, MONTH ) )DATEADD takes three parameters: the date column, the number of periods (negative = back in time), and the type (DAY, MONTH, QUARTER, YEAR).
SAMEPERIODLASTYEAR(Datum[Datum]) is equivalent to DATEADD(Datum[Datum], -1, YEAR). DATEADD is more flexible, but SAMEPERIODLASTYEAR reads better for the most common scenario.
What often goes wrong here?
People assume that as long as they have a date column in their transaction table, everything will work. It doesn't. Time functions like SAMEPERIODLASTYEAR() need a complete, continuous calendar without gaps (missing days).
If you only have the dates on which something was sold, and you don't sell every day, dates are missing. And then your time analyses don't work.
dates are missing
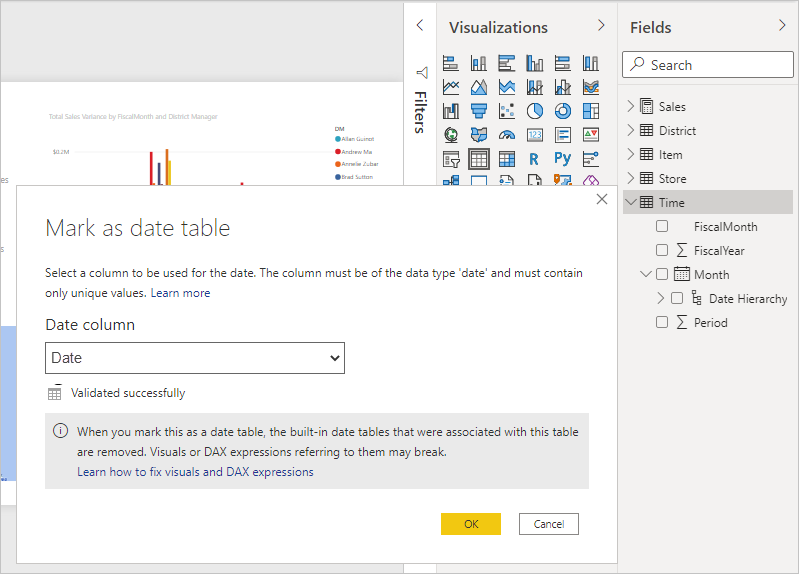
A closer look: Mark as Date Table
Once you've created a date table, mark it as such:
mark
- Select your date table in Power BI
- Go to Modeling > Mark as date table
- Choose the column with full dates (e.g. Datum)
This tells Power BI: "Use this table for time analyses"
Tips & checks from practice:
- Always use a separate date table
- Create one clear relationship between that table and your facts (e.g. Verkoopregels[Datum])
- Add Year, Month and Quarter as columns (not as measures)
- Use DIVIDE() for percentage growth
- Test your measures with slicers on date, year and month
Practical example:
You have a report with sales data. You want to:
- Show revenue YTD
- Show last year's revenue (same period)
- Show the difference and % growth
- Filter on Year and Month in the slicer
You create the measures:
- OmzetYTD = TOTALYTD([TotaleOmzet], Kalender[Datum])
- OmzetVorigJaar = CALCULATE([TotaleOmzet], SAMEPERIODLASTYEAR(Kalender[Datum]))
In your slicers you use Kalender[Jaar] and Kalender[Maand]. Everything works, automatically.
Common mistake:
Building time analyses without a date table. You end up with empty visuals or wrong comparisons. Power BI doesn't warn you, but your numbers can't be trusted.
How to avoid it:
Always build a complete date table. Relate it to your facts. And use only that table in your time measures and filters.
Assignment:
- Create a date table with the Power Query code from the attachmentMark the table as "Date Table"Create a relationship with Verkoopregels[Verkoopdatum]
Create a date table with the Power Query code from the attachment
- Mark the table as "Date Table"
- Create a relationship with Verkoopregels[Verkoopdatum]
- Build these DAX measures:OmzetYTDLast year's revenueGrowth versus last year (absolute and percentage)
Build these DAX measures:
- OmzetYTD
- Last year's revenue
- Growth versus last year (absolute and percentage)
- Test them in a visual and add slicers on Year and Month
Reflection question:
Are you still using dashboards without a real date table? Then how do you know for sure your time analyses are right?
Want to keep your progress, get the practice files and sign up for the free evening? Create a free account. All you do is click a link in your email.
Create a free account