Relationships Deep Dive
You understand active vs inactive relationships and cross-filter directions.
Why this lesson matters
You've created relationships in Model view. It seemed to work. Until your report suddenly shows odd totals. Or filters that do nothing. Or a visual that just stays empty.
Relationships are the nervous system of your data model. If they're wrong, nothing is right. We'll go deeper into how relationships work, when to choose which type, and how to track down problems.
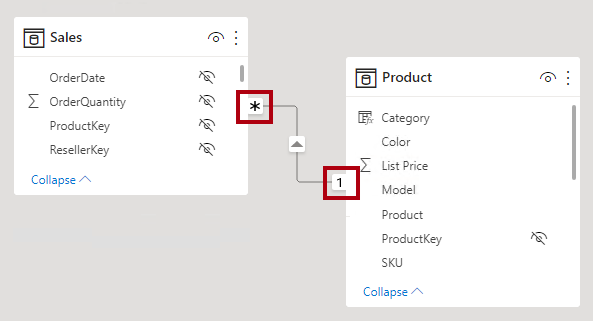
The basics: the one-to-many (1:*) relationship
This is the most common relationship in Power BI and the foundation of the star schema:
- Dimension table (1 side): Klanten, Producten, Datum
- Fact table (* side): Verkoopregels, Boekingen, Transacties
The dimension table filters the fact table. Never the other way round.
-- This measure works correctly thanks to the relationship Klanten → Verkoopregels:
OmzetPerKlant = SUM( Verkoopregels[NettoOmzet] )
-- If you filter on Klanten[Regio] = "Noord", SUM only counts the sales rows
-- of customers in region Noord.You have a dimension table Producten (500 rows) and a fact table Verkoopregels (100,000 rows). Which table is on the "1" side of the relationship?
Cross-filter direction
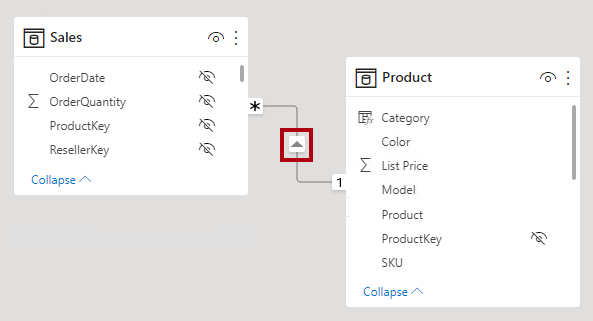
The arrow on the relationship line shows the filter direction. By default the "1" side filters the "*" side.
| Direction | Meaning | When to use |
|---|---|---|
| Single (→) | Dimension filters fact | Default, almost always correct |
| Both (↔) | Both sides filter each other | Only for many-to-many or special cases |
When single (default)
In 95% of cases you want the default single direction. Klanten filters Verkoopregels. Datum filters Verkoopregels. Producten filters Verkoopregels.
Keep reading
Leave your name and email address and you can read the rest
You get the whole lesson right away, and every other lesson stays open after that. No password, no confirmation email.
When bidirectional
Microsoft's advice: keep the use of bidirectional relationships to a minimum. They can hurt query performance and produce confusing results. Use bidirectional only for:
- One-to-one relationships (always bidirectional, can't be set any other way)
- Many-to-many via a bridge table
- A slicer "with data", when you want a slicer to show only values for which data exists
One-to-one relationships
Two tables with a 1:1 relationship contain the same key, and every value appears exactly once in both tables.
Where do you see this?
- Separate tables for sensitive data (salaries kept apart from employees)
- Tables split up to keep the model smaller
Best practice: consider whether you can merge the tables in Power Query instead. That's often simpler than a 1:1 relationship.
Many-to-many relationships
This is the most complex relationship type. Example: one salesperson works in several regions, and one region has several salespeople.
-- With a many-to-many relationship you can NOT simply filter.
-- Power BI warns you: "the relationship may cause double counting"
The solution: a bridge table
| VerkoperID | RegioID |
|---|---|
| V001 | Noord |
| V001 | Oost |
| V002 | Noord |
| V003 | West |
| V003 | Zuid |
This intermediate table has:
- A many-to-one relationship to Verkopers (VerkoperID)
- A many-to-one relationship to Regio's (RegioID)
- Both relationships bidirectional
You have three tables: Klanten, Verkoopregels and Producten. Verkoopregels has relationships with both. You want a matrix with the number of unique products per customer. What do you need?
Active vs inactive relationships
Between two tables there can be only one active relationship. But you can create several, and the extra ones automatically become inactive (dotted line in Model view).
Example: a date table that relates to both Orderdatum and Factuurdatum in Verkoopregels.
-- Active relationship: Datum → Verkoopregels[Orderdatum]
OmzetPerOrdedatum = SUM( Verkoopregels[NettoOmzet] )

-- Activate the inactive relationship with USERELATIONSHIP:
OmzetPerFactuurdatum =
CALCULATE(
    SUM( Verkoopregels[NettoOmzet] ),
    USERELATIONSHIP( Datum[Datum], Verkoopregels[Factuurdatum] )
)Use it when you want to relate the same dimension table (e.g. Datum) to your fact table in more than one way. The active relationship is your default (e.g. order date). With USERELATIONSHIP you temporarily activate an inactive relationship for a specific measure.
Tracking down problems
| Symptom | Likely cause | Solution |
|---|---|---|
| Total is wrong | Wrong relationship or cardinality | Check Model view, verify the "1" vs "*" side |
| Filter does nothing | No relationship or wrong filter direction | Create the relationship, check the arrow direction |
| Visual is empty | Missing relationship | Create the relationship between the tables |
| Duplicate values | Many-to-many without a bridge table | Add a bridge table |
| Every row shows the same value | Relationship on the wrong column | Check that your keys are unique on the "1" side |
You have a measure TotaleOmzet = SUM( Verkoopregels[NettoOmzet] ). In a matrix you see that the total per customer is the same number every time (the overall total). What's the problem?
Always look at your filter arrows in Model view. They tell the whole story: who filters whom, and in which direction. If an arrow points the wrong way, you know straight away where the problem is.
- One-to-many (1:*) is the standard relationship, dimension filters fact
- Filter direction is single (→) by default, bidirectional only for many-to-many or 1:1
- Bridge table is the solution for many-to-many between dimension tables
- USERELATIONSHIP activates an inactive relationship in a measure
- When in trouble: check Model view for missing relationships, wrong cardinality or arrow direction
Want to keep your progress, get the practice files and sign up for the free evening? Create a free account. All you do is click a link in your email.
Create a free account