Smart Narratives: Automated Text Summaries
You add dynamic text summaries to your reports.
Why this lesson matters
Charts work, but not everyone reads them well. Some stakeholders just want a few sentences that tell them what's going on. "Revenue is up 12%, driven by growth in region North". That's what a director wants to read.
Smart narratives do exactly that. It's an AI-powered visual in Power BI that automatically generates text summaries based on your data. You skip the manual typing and the static text that's out of date after a refresh.
What are Smart narratives?
Smart narrative is a visual type in Power BI that uses AI to generate text that updates itself. It analyses your data and writes summaries in natural language.
What it gives you:
- Automatic description of trends and outliers
- Text that updates with every data refresh
- Summaries with context that complement the charts
- Insights that non-analytical users can read
The Smart narrative visual is simply part of Power BI Desktop. You don't need Fabric capacity for it. The variant where Copilot writes it for you does require Fabric or Premium, because that one runs on Copilot rather than on the visual itself.
Adding a Smart narrative
Method 1: Blank Smart narrative
- 1In the Visualizations pane, click the Smart narrative icon (text with a star)
- 2Drag the visual onto your canvas
- 3Power BI automatically generates a summary based on all the visuals on the page
Method 2: Summary of a specific visual
- 1Right-click an existing visual (say, a bar chart)
- 2Choose Summarize (Samenvatten if your Desktop runs in Dutch)
- 3Power BI creates a Smart narrative that describes that specific visual
Method 2 is often better. A summary of the whole page can get too generic. By summarising per visual you get more targeted text that you can place next to the matching chart.
Keep reading
Leave your name and email address and you can read the rest
You get the whole lesson right away, and every other lesson stays open after that. No password, no confirmation email.
Dynamic values and variables
The most powerful part of Smart narratives is that you can adjust the generated text with dynamic values.
How dynamic values work
You don't type those values as code yourself. Power BI inserts them as a token that you link to a field or measure, and that token recalculates itself as soon as someone filters. Under the Review tab you see all the values you've already defined, and there you can reuse, edit or delete them.
Step by step: live text
- 1Double-click the Smart narrative to edit it
- 2Type the text you want
- 3Click + Value to insert a dynamic value
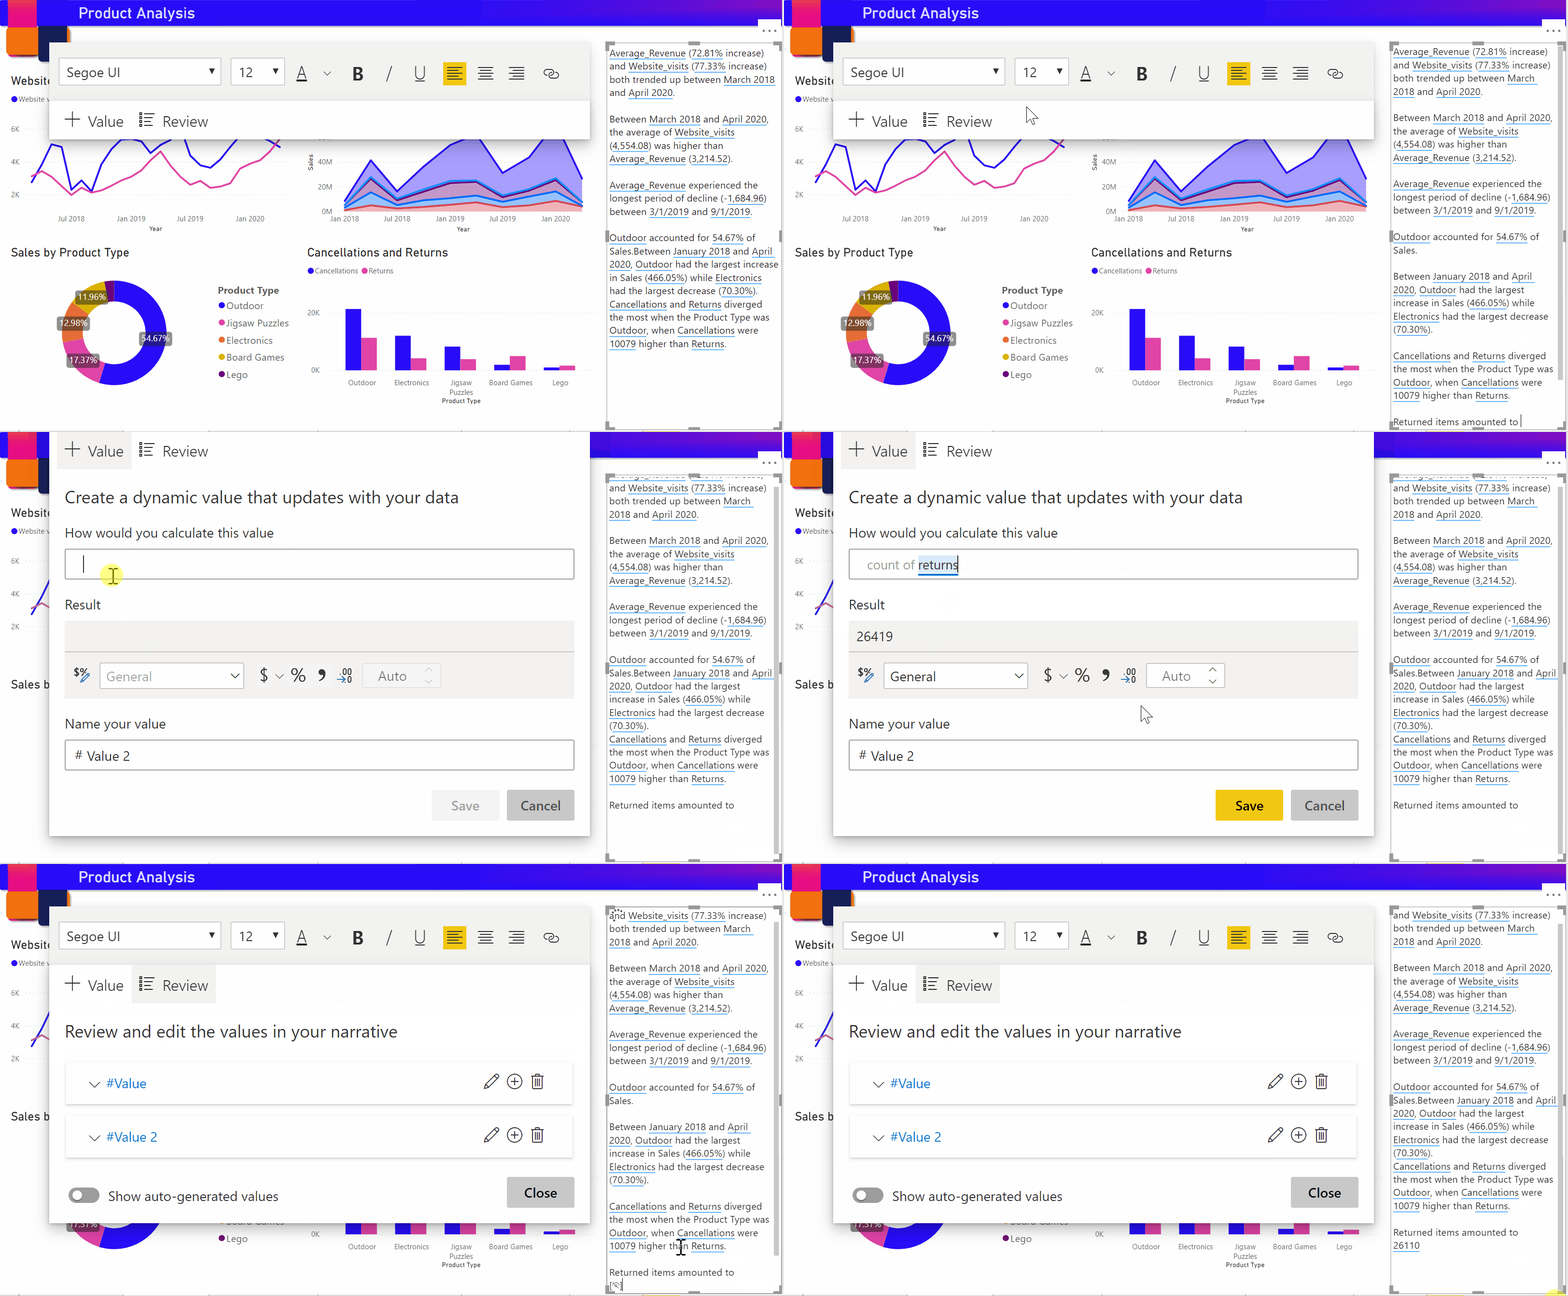
- 1Select the measure or column
- 2Set a format if needed (currency, percentage, etc.)
Dynamic values respond to filters and slicers. That works well, but always test what happens when a user applies a filter that results in empty data. A sentence like "Revenue amounts to euro" without a number is sloppy. Build in a fallback.
Adjusting and refining
The auto-generated text is a starting point. This is how you make it better:
Adjusting language and tone
| Auto-generated | Edited by hand |
|---|---|
| "Sum of Revenue is 1,245,000" | "Total revenue amounts to EUR 1.2 million" |
| "Category A has the highest value" | "Product line A is the strongest performer" |
| "There is a decrease of 5%" | "Note: revenue is down 5%, action needed" |
Adding context
Smart narratives describe what is in the data. The why you add yourself:
Revenue in Q3 amounts to {SUM(Sales[Revenue])} euros.
That is {CHANGE_PCT}% compared to Q2.

[Added by hand:]
The decline is explained by the seasonal effect
and the delayed product launch in August.Practical uses
1. Executive dashboards
Add a Smart narrative at the top of every page that summarises the key message. Board members scan the text, the details are in the charts below.
2. Automated reporting
For daily or weekly reports by email (Power BI subscriptions), a Smart narrative delivers the essence right away, even if the recipient doesn't open the report.
3. Presentations
Export the report page as PowerPoint. The Smart narrative is exported along with it as text, so your presentation contains a story from the start.
What is the biggest advantage of dynamic values in Smart narratives?
When is Method 2 (summary per visual) better than a blank Smart narrative?
Want to keep your progress, get the practice files and sign up for the free evening? Create a free account. All you do is click a link in your email.
Create a free account